LogRhythm is a “NextGen SIEM” that allows much more than log management. They include all the current cyber security acronyms in their SIEM solution such as UEBA, NTBA, SAO, and TLM. I will be focusing on the network traffic and behavior analytics offering called LogRhythm NetMon.
LogRhythm NetMon is used to collect inline or mirrored traffic traversing your network and provide the ability to analyze packets from layer 2-7. Rules can be created to recognize malicious file transfers, possible C&C communication, lateral movement, data ex-filtration, or other possible inappropriate network usage.
This procedure with guide you step-by-step on how to configure LogRhythm NetMon Freemium for your home network. Before starting the guide, ensure you have a similar network setup to ensure the tool received all the traffic sent through your network.

First, head on over to the LogRhythm support page and create an account here.

Navigate to the LogRhythm community and select NetMon.
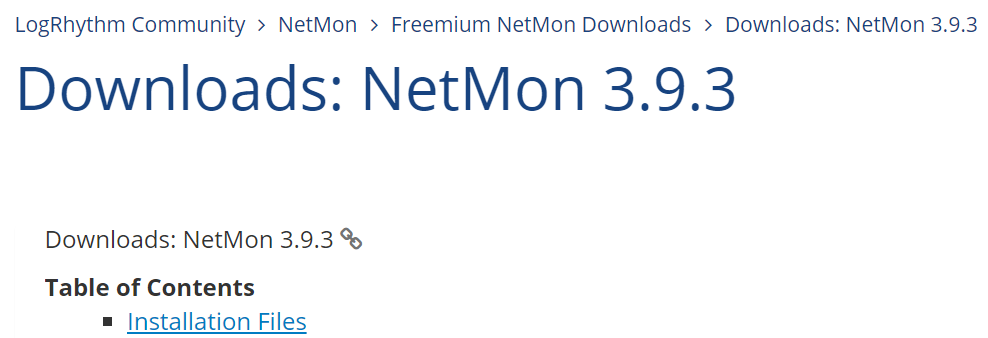
There are two options: ISO or VM Image. For this procedure I will be using the ISO.
Next I uploaded the ISO to the VMware datastore and attached to the VM with the following specifications:
- 2 vCPU
- 8GB Memory
- 60GB Storage (Required)
- 2 NIC
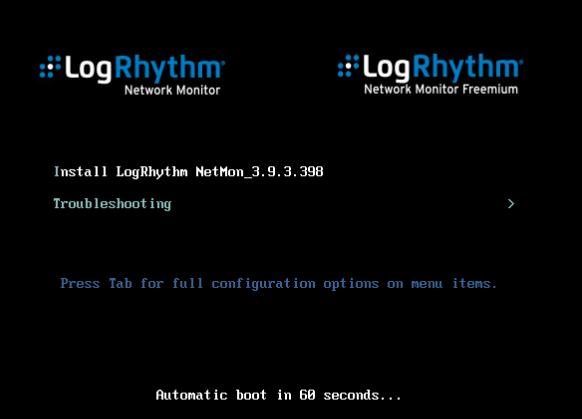
Spin up the VM and you will see a LogRhythm splash page. Select Install LogRhythm NetMon_Version.
Default CLI creds:
Username: logrhythm
Password: changeme

Change password first thing!
[logrhythm@localhost ~]$ passwd
Changing password for user logrhythm.
Changing password for logrhythm.
(current) UNIX password:
New password:
Retype new password:
passwd: all authentication tokens updated successfully.
The image has a script located in the following directory to configure the network adapters: /usr/local/probe/scripts/AddEth.pl
[logrhythm@localhost ~]$ sudo /usr/local/probe/scripts/AddEth.pl -i IP_ADDRESS -s NETMASK -g GATEWAY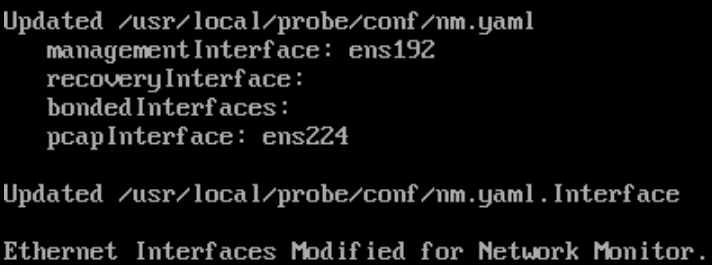
After reboot. Navigate to the management IP address configured above. https://Management_IP
Default Web creds:
Username: admin
Password: changeme
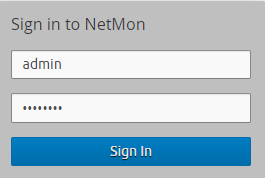
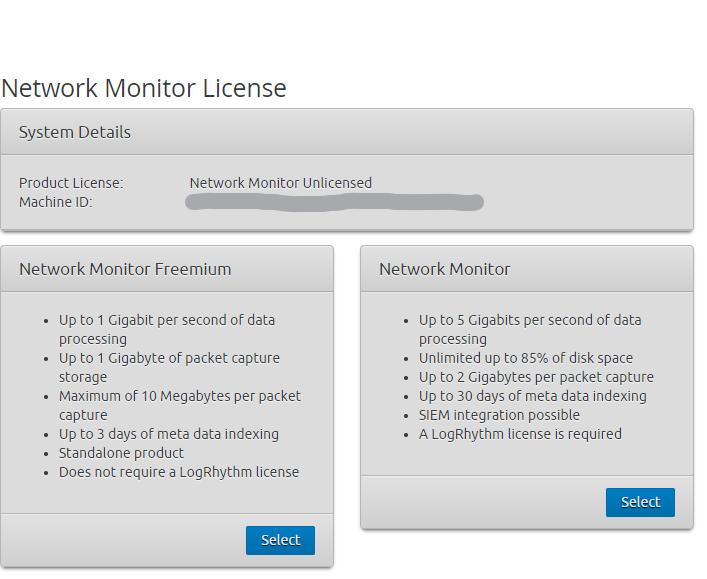
After password change we will be prompted to select the desired license. Network Monitor Freemium.
Register admin:

Immediately we begin seeing network traffic represented in the Analyze Dashboard.
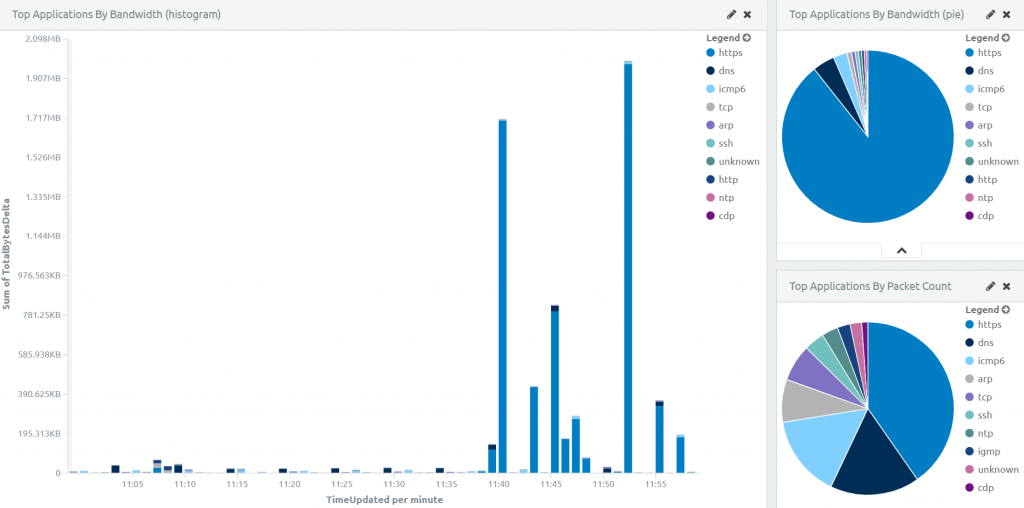

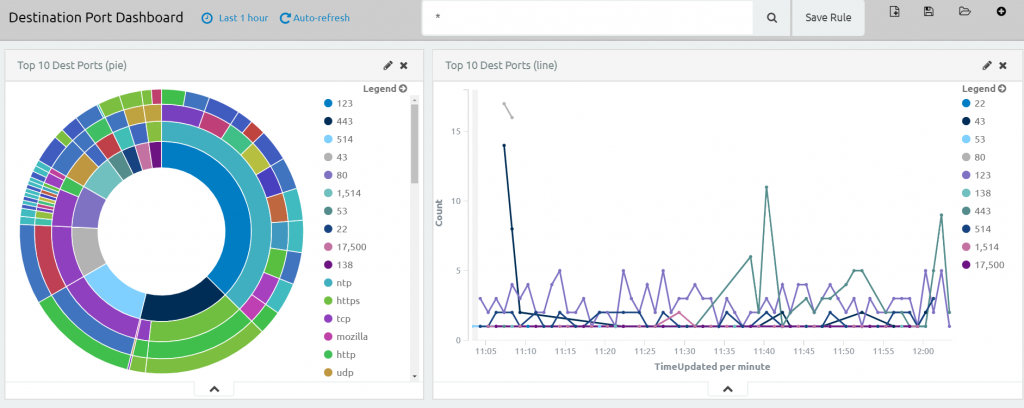
By default no rules will be enabled so the Alarms tab will be empty.

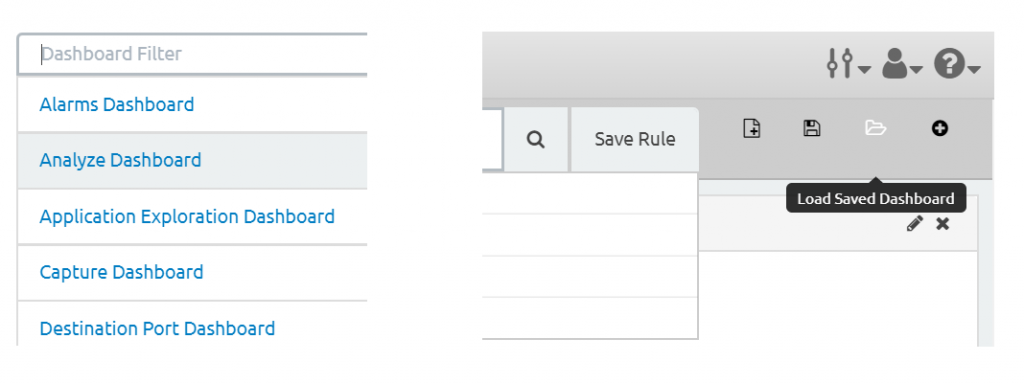
*Note if you click on Alarms and now see “No Results Found”, click the Load Saved Dashboards to the right of the search bar and select one of the available dashboards.
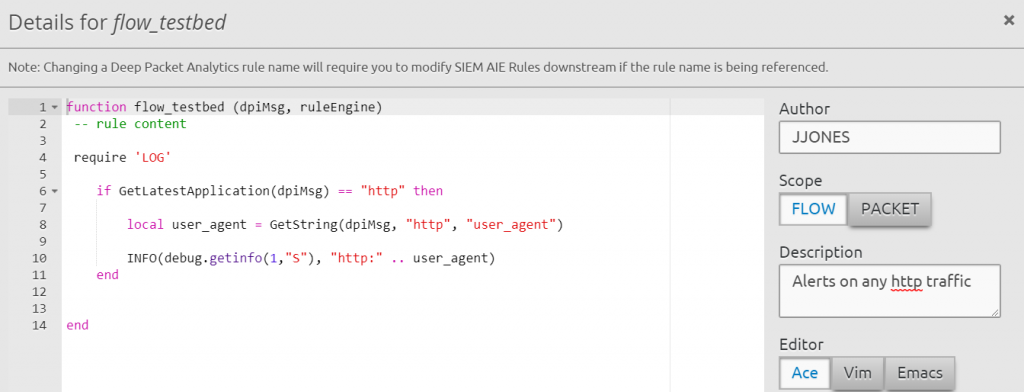
Custom rules that trigger based on metadata found in packet can be added under the Rules > Compose New DPA Rule > Compose. Below you will see an example of a custom rule I created to trigger on http traffic.
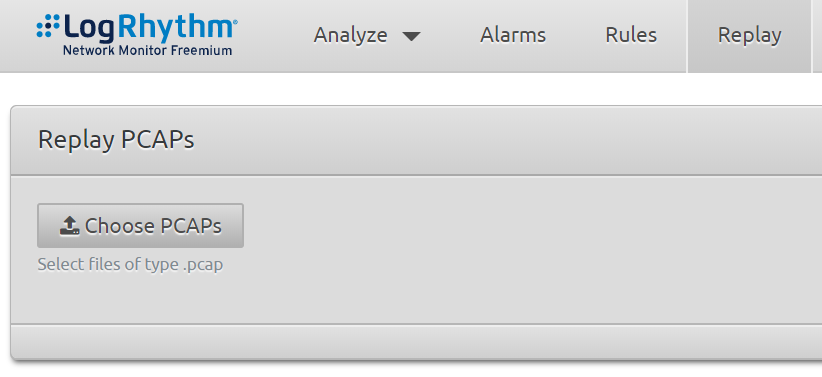
LogRhythm NetMon also has the ability to replay .pcap for deep packet inspection.
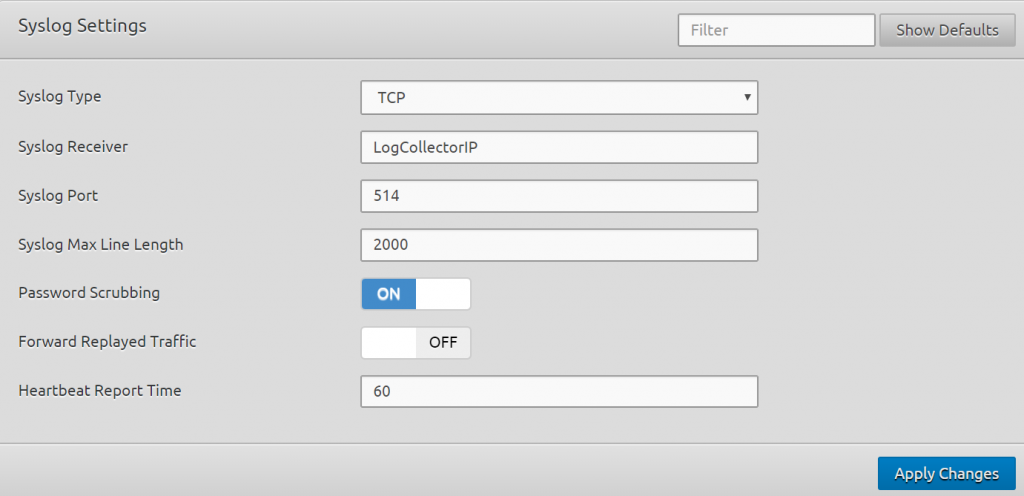
SIEM log collection settings can be found under Configuration > Syslog. I will be configuring my NetMon build to send logs to my Security Onion server.
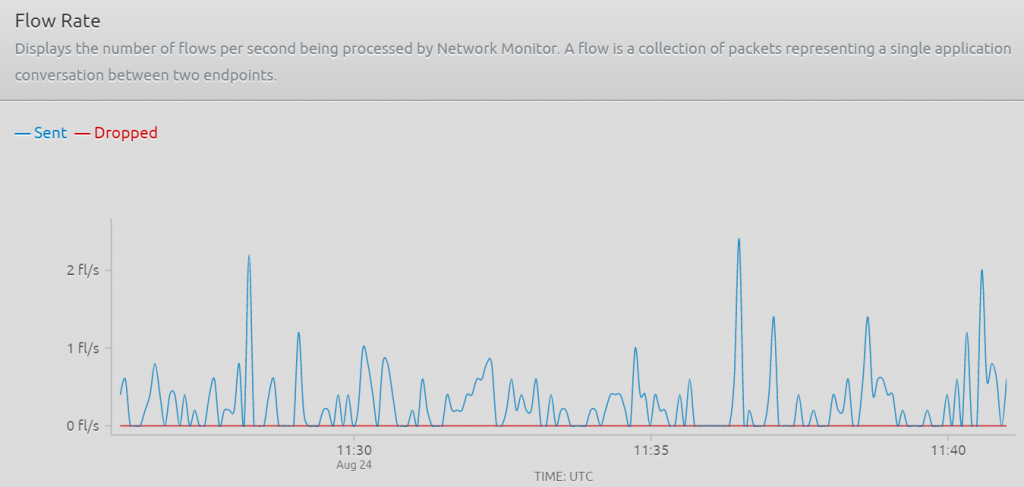
Diagnostics will show rate metrics for troubleshooting.
Another great resource while building DPA rules is the Logs > Flow Logs. This shows what rule is triggering successfully or failing due to an issue. Below you can see the logs from the custom DPA rule shown above.

LogRhythm network monitor is easy tool to configure and provides a great way to visibly recognize and alert on any anomalous behavior on your network.
Check back for a deep dive into creating Deep Packet Analysis rules using LUA. Until then check out the LUA Documentation, and until next time, stay safe in the trenches of IT!
