
Recently, I have started tinkering with Splunk dashboards and thought about systems or applications I would want to monitor from a “single pane of glass”. OpenVPN is my first thought due to the importance and wide use in the community. My OpenVPN build is on a CentOS 7 VM, so I will be using the Splunk Fowarder to push the data I need to collect in Splunk.
First things first, what do I want to know at a glance from the Splunk dashboard?
- Connection Success / Failed
- Current connections (User)
- Data Sent/Received
Connection Attempts
The logs we need for connection attempts are stored in /var/log/messages
Here are the successful connection logs:
Dec 1 16:45:06 vpn openvpn: Sun Dec 1 16:45:06 2019 us=778288 client/11.22.33.44:52358 MULTI: Learn: 10.8.0.6 -> client/11.22.33.44:52358
Dec 1 16:45:06 vpn openvpn: Sun Dec 1 16:45:06 2019 us=778313 client/11.22.33.44:52358 MULTI: primary virtual IP for client/11.22.33.44:52358: 10.8.0.6
Dec 1 16:45:06 vpn openvpn: Sun Dec 1 16:45:06 2019 us=782022 client/11.22.33.44:52358 PUSH: Received control message: 'PUSH_REQUEST'
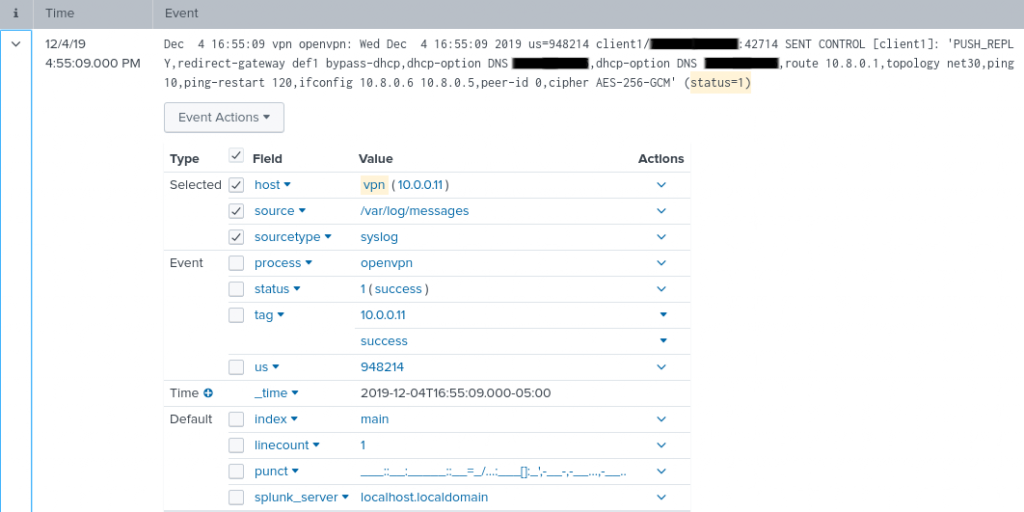
Dec 1 16:45:06 vpn openvpn: Sun Dec 1 16:45:06 2019 us=782121 client/11.22.33.44:52358 SENT CONTROL [client]: 'PUSH_REPLY,redirect-gateway def1 bypass-dhcp,dhcp-option DNS DNSIP1,dhcp-option DNS DNSIP2,route 10.8.0.1,topology net30,ping 10,ping-restart 120,ifconfig 10.8.0.6 10.8.0.5,peer-id 0,cipher AES-256-GCM' (status=1)The most important log here is the last line (status=1). This indicates success, while (status=1/failure) is a failure.
Ensure we have the Splunk forwarder to give us the /var/log/messages with this command on the OpenVPN server:
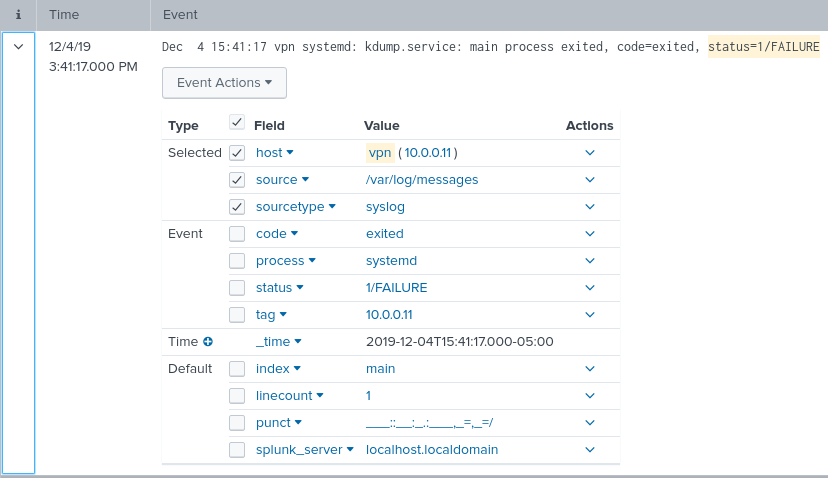
./splunk add monitoring /var/logThe raw data coming into Splunk now need to recognize the status. To do that we will use field extractions. Drop down the event > Event Actions > Extract Fields
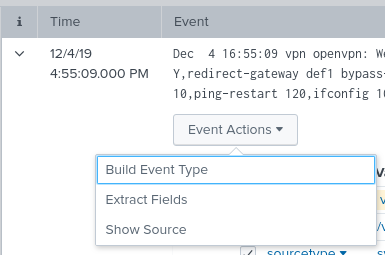
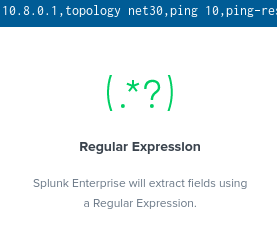
Select regular expression > Next:
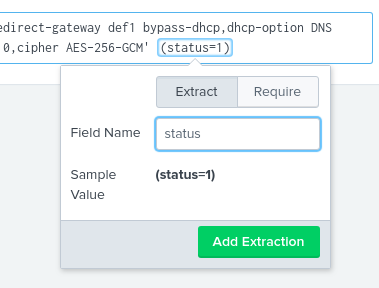
Select the (status=1) and name the field “status” > Add Extraction:
Regular Expression
^[^\]\n]*\](?P<action>:\s+\w+\s+\w+\s+\w+\s+\w+)
Now lets take a look at what we are getting in Splunk.
Success:
Failure:
After the field extraction has been configured we can use the following search in Splunk to the desired results.
host="vpn" status="Status=1" OR status="1/FAILURE" | stats count(status) by status | replace "status=1" with "Success" | replace "1/FAILURE" with Failure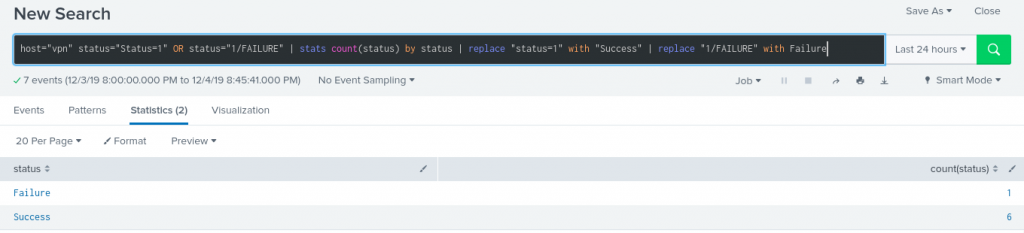
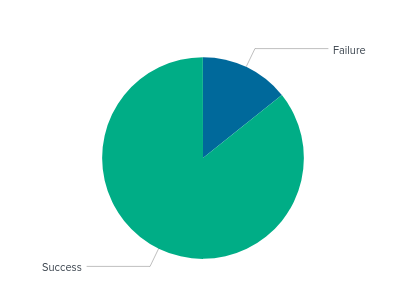
Now we will create the Visualization for the dashboard. Click the Visualization tab and select Pie Chart. Save to new Dashboard and create a panel for the Visualization.
Current Connections
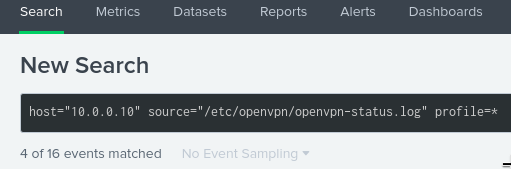
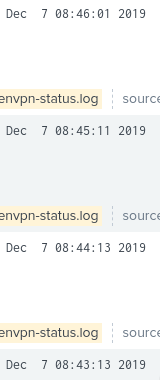
Now I want currently connected profile information. I found this log in the /etc/openvpn/openvpn-status.log
Add forwarding to this log with the following command:
[root@vpn bin]# ./splunk add monitor /etc/openvpn/openvpn-status.log
Your session is invalid.  Please login.
Splunk username: admin
Password:
Added monitor of '/etc/openvpn/openvpn-status.log'.
Here is what we get in Splunk.

Begin another field extraction with the relevant sample.

Next > Regular Expression > Next :
Field extractions:
- 10.8.0.6 = issued_ip
- client1 = profile
- SourceIP = src_ip
- 37462 = src_port
- Dec 7 … = date

Regular Expression
^(?P<issued_ip>[^,]+),(?P<profile>\w+),(?P<src_ip>[^:]+):(?P<src_port>\d+)[^ \n]* (?P<Date>\w+\s+\d+\s+\d+:\d+:\d+\s+\d+)
The following search will give us the data we need for the visualization.
So we get one profile connection log approx. every minute, so if we save the search with 1 minute real-time the current connections should be accurate.
Splunk search used to create table and clean up field names.
host="10.0.0.10" source="/etc/openvpn/openvpn-status.log" profile=* |table Date,src_ip,src_port,issued_ip | rename src_ip as "Source IP", src_port as "Source Port", issued_ip as "VPN Issued IP"Dashboard panel visualization:

Sent/Received Data
The data we need is stored in the source=”/etc/openvpn/openvpn-status.log” The numbers after the source port represent received and sent data in KB. Use field extractions to pull the values from the logs.

Regular Expression
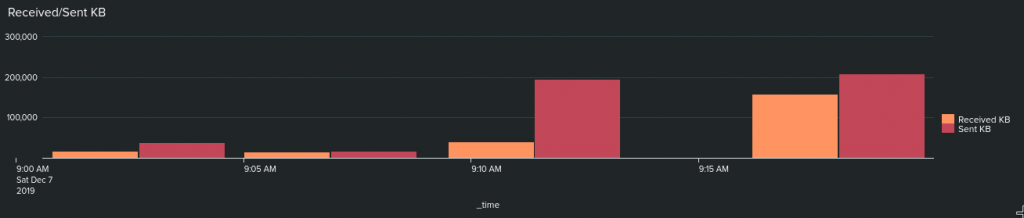
^[^:\n]*:\d+,(?P<rcv_kb>\d+),(?P<sent_kb>\d+)Splunk Search to grab the sent and received totals in an hour.
host="10.0.0.10" source="/etc/openvpn/openvpn-status.log" rcv_kb=* |table _time,rcv_kb,sent_kb | rename rcv_kb as "Received KB", sent_kb as "Sent KB"The above search visualized as a bar chart:
Conclusion
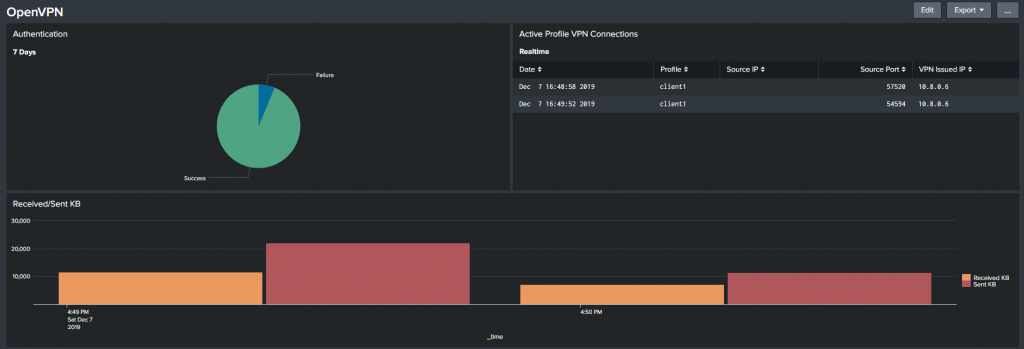
The goal of having visualizations for the following data for OpenVPN is complete: Connection Success/Failures, currently connected profiles, and data received/sent over time.
Final Dashboard for OpenVPN:
The configuration was simple yet very useful for a quick glance to see the OpenVPN log data visually. Reach out here for any questions or comments.
Until next time stay safe in the Trenches of IT!